Note
Go to the end to download the full example code.
01.c. Acquisition operators (HadamSplit2d)
This tutorial shows how to simulate measurements that correspond to the 2D Hadamard transform of an image. It based on the spyrit.core.meas.HadamSplit2d class of the spyrit.core.meas submodule.
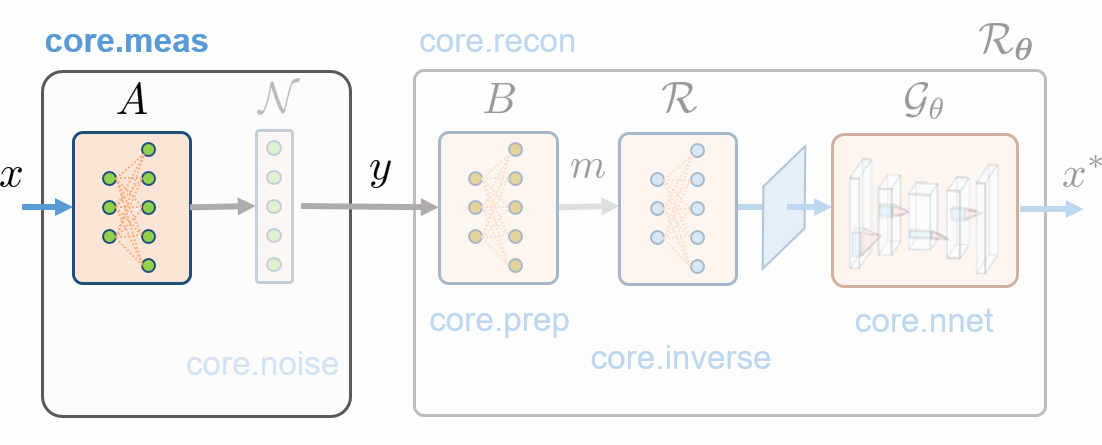
In practice, only positive values can be implemented using a digital micromirror device (DMD). Therefore, we acquire
where \(A \in \mathbb{R}_+^{2h\times h}\) is the acquisition matrix that contains the positive and negative components of a Hadamard matrix and \(X \in \mathbb{R}^{h\times h}\) is the (2D) image.
We define the positive DMD patterns \(A\) from the positive and negative components a Hadamard matrix \(H\). In practice, the even rows of \(A\) contain the positive components of \(H\), while odd rows of \(A\) contain the negative components of \(H\).
\[\begin{split}\begin{cases} A[0::2, :] = H_{+}, \text{ with } H_{+} = \max(0,H),\\ A[1::2, :] = H_{-}, \text{ with } H_{-} = \max(0,-H). \end{cases}\end{split}\]
Loads images
We load a batch of images from the /images/ folder with values in (0,1).
import os
import torchvision
import torch.nn

import matplotlib.pyplot as plt

from spyrit.misc.disp import imagesc
from spyrit.misc.statistics import transform_gray_norm

spyritPath = os.getcwd()
imgs_path = os.path.join(spyritPath, "images/")

# Grayscale images of size 64 x 64, values in (-1,1)
transform = transform_gray_norm(img_size=64)

# Create dataset and loader (expects class folder 'images/test/')
dataset = torchvision.datasets.ImageFolder(root=imgs_path, transform=transform)
dataloader = torch.utils.data.DataLoader(dataset, batch_size=7)

x, _ = next(iter(dataloader))
print(f"Ground-truth images: {x.shape}")
Ground-truth images: torch.Size([7, 1, 64, 64])
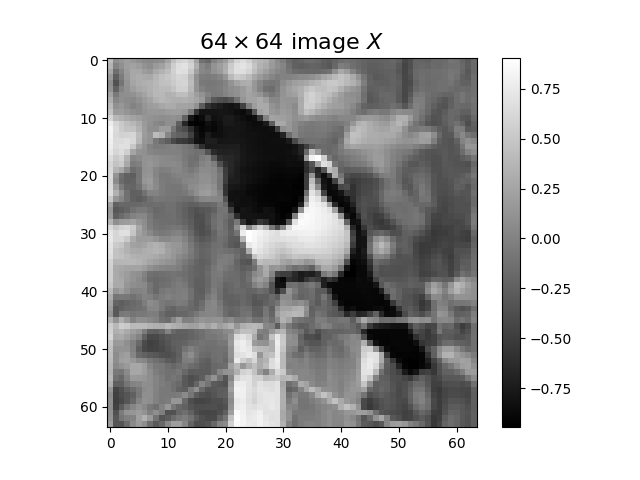
We select the second image in the batch and plot it.
i_plot = 1
imagesc(x[i_plot, 0, :, :], r"$64\times 64$ image $X$")
/home/docs/checkouts/readthedocs.org/user_builds/spyrit/envs/3.1.1/lib/python3.11/site-packages/matplotlib/cbook.py:684: DeprecationWarning: __array__ implementation doesn't accept a copy keyword, so passing copy=False failed. __array__ must implement 'dtype' and 'copy' keyword arguments. To learn more, see the migration guide https://numpy.org/devdocs/numpy_2_0_migration_guide.html#adapting-to-changes-in-the-copy-keyword
  x = np.array(x, subok=True, copy=copy)
Basic example
We instantiate an HadamSplit2d object and simulate the 2D hadamard transform of the input images. As measurements are split, this produces vectors of size \(64 \times 64 \times 2 = 8192\).
from spyrit.core.meas import HadamSplit2d

meas_op = HadamSplit2d(64)
y = meas_op(x)

print(y.shape)
torch.Size([7, 1, 8192])
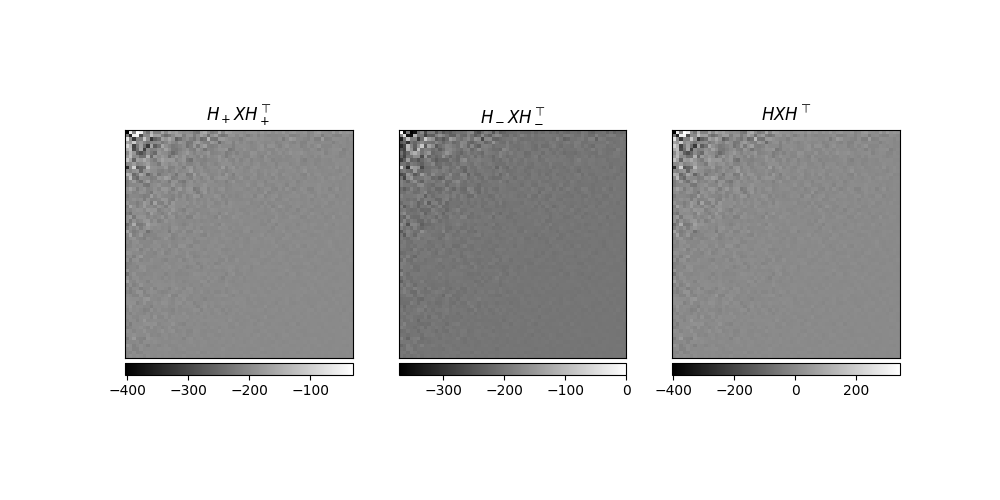
As with spyrit.core.meas.LinearSplit, the spyrit.core.HadamSplit2d.measure_H() method simulates measurements using the matrix \(H\), i.e., it computes \(m = \texttt{vec}\left(HXH^\top\right)\). This produces vectors of size \(64 \times 64 = 4096\).
meas_op = HadamSplit2d(64)
m = meas_op.measure_H(x)

print(m.shape)
torch.Size([7, 1, 4096])
We plot the components of the positive and negative Hadamard transform that are concatenated in the measurement vector \(y\) as well as the measurement vector \(m\).
from spyrit.misc.disp import add_colorbar, noaxis

y_pos = y[:, :, 0::2]
y_neg = y[:, :, 1::2]

f, axs = plt.subplots(1, 3, figsize=(10, 5))
axs[0].set_title(r"$H_+XH_+^\top$")
im = axs[0].imshow(y_pos[1, 0].reshape(64, 64), cmap="gray")
add_colorbar(im, "bottom")

axs[1].set_title(r"$H_-XH_-^\top$")
im = axs[1].imshow(
    y_neg[
        1,
        0,
    ].reshape(64, 64),
    cmap="gray",
)
add_colorbar(im, "bottom")

axs[2].set_title(r"$HXH^\top$")
im = axs[2].imshow(m[1, 0].reshape(64, 64), cmap="gray")
add_colorbar(im, "bottom")

noaxis(axs)
# sphinx_gallery_thumbnail_number = 2
/home/docs/checkouts/readthedocs.org/user_builds/spyrit/envs/3.1.1/lib/python3.11/site-packages/matplotlib/cbook.py:684: DeprecationWarning: __array__ implementation doesn't accept a copy keyword, so passing copy=False failed. __array__ must implement 'dtype' and 'copy' keyword arguments. To learn more, see the migration guide https://numpy.org/devdocs/numpy_2_0_migration_guide.html#adapting-to-changes-in-the-copy-keyword
  x = np.array(x, subok=True, copy=copy)
Subsampling
To reduce the acquisition time, only a few of the measurement can be acquired. In thise case, we simulate:
where \(\mathcal{S} \colon\, \mathbb{R}^{2h\times 2h} \to \mathbb{R}^{2M}\) is a subsampling operator and \(2M < 2h\) represents the number of DMD patterns that are displayed on the DMD.
The subsampling operator \(\mathcal{S}\) is defined by an order matrix \(O\in\mathbb{R}^{h\times h}\) that ranks the measurements by decreasing significance, before retaining only the first \(M\).
Note
This process applies to both \(H_{+}XH_{+}^T\) and \(H_{-}XH_{-}^T\) the same way, independently.
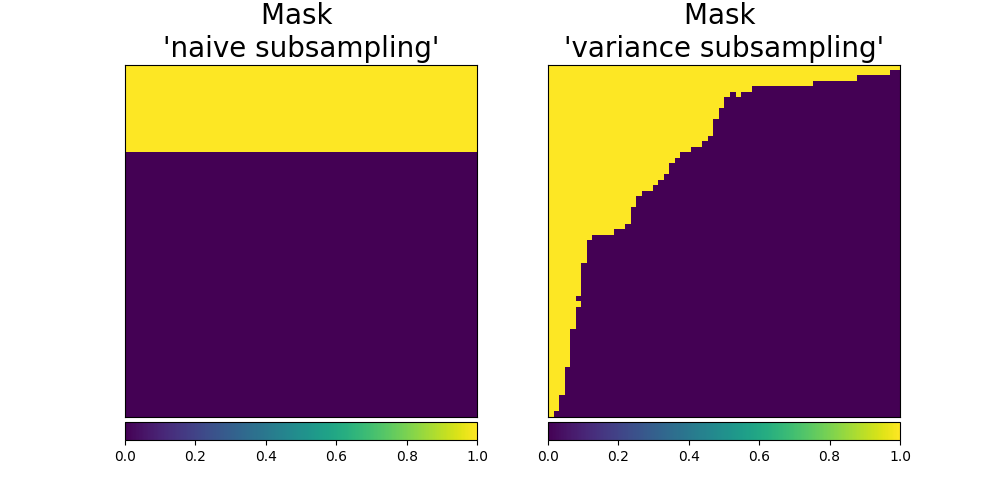
We consider two subsampling strategies:
The “naive” subsampling, which uses the linear (row-major) indexing order. This is the default subsampling strategy.
The variance subsampling, which sorts the Hadamard coefficient by decreasing variance. The motivation is that low variance coefficients are less informative than the others. This can be supported by principal component analysis, which states that preserving the components with largest variance leads to the best linear predictor.
Naive subsampling
The order matrix corresponding to the “naive” subsampling is given by linear values.
Ord_naive = torch.arange(64 * 64, 0, step=-1).reshape(64, 64)
print(Ord_naive)
tensor([[4096, 4095, 4094,  ..., 4035, 4034, 4033],
        [4032, 4031, 4030,  ..., 3971, 3970, 3969],
        [3968, 3967, 3966,  ..., 3907, 3906, 3905],
        ...,
        [ 192,  191,  190,  ...,  131,  130,  129],
        [ 128,  127,  126,  ...,   67,   66,   65],
        [  64,   63,   62,  ...,    3,    2,    1]])
Variance subsampling
The order matrix corresponding is obtained by computing the variance of the Hadamard coefficients of the images belonging to the ImageNet 2012 dataset.
First, we download the covariance matrix from our warehouse. The covariance was computed from the ImageNet 2012 dataset and has a size of (64*64, 64*64).
from spyrit.misc.load_data import download_girder

# url of the warehouse
url = "https://tomoradio-warehouse.creatis.insa-lyon.fr/api/v1"
dataId = "672207cbf03a54733161e95d"  # for reconstruction (imageNet, 64)
data_folder = "./stat/"
cov_name = "Cov_64x64.pt"

# download the covariance matrix and get the file path
file_abs_path = download_girder(url, dataId, data_folder, cov_name)

try:
    # Load covariance matrix for "variance subsampling"
    Cov = torch.load(file_abs_path, weights_only=True)
    print(f"Cov matrix {cov_name} loaded")
except:
    # Set to the identity if not found for "naive subsampling"
    Cov = torch.eye(64 * 64)
    print(f"Cov matrix {cov_name} not found! Set to the identity")
Local folder not found, creating it... done.
Downloading Cov_64x64.pt...
Downloading Cov_64x64.pt... done.
Cov matrix Cov_64x64.pt loaded
Then, we extract the variance from the covariance matrix. The variance matrix has a size of (64, 64).
Note
In this tutorial, the covariance matrix is used to define the subsampling strategy. As explained in Tutorial 5 , the covariance matrix can also be used as a prior for image reconstruction.
Comparison of the two subsampling strategies
We plot the masks corresponding to the two order matrices for a subsampling factor of 4, which corresponds to \(M = 64 \times 64 / 4 = 1024\) measurements.
# sphinx_gallery_thumbnail_number = 2
We build the masks using the function spyrit.core.torch.sort_by_significance() and reshape them to the image size.
from spyrit.core.torch import sort_by_significance

M = 64 * 64 // 4
mask_basis = torch.zeros(64 * 64)
mask_basis[:M] = 1

# Mask for the naive subsampling
mask_nai = sort_by_significance(mask_basis, Ord_naive, axis="cols")
mask_nai = mask_nai.reshape(64, 64)

# Mask for the variance subsampling
mask_var = sort_by_significance(mask_basis, Ord_variance, axis="cols")
mask_var = mask_var.reshape(64, 64)
We finally plot the masks.
f, ax = plt.subplots(1, 2, figsize=(10, 5))
im = ax[0].imshow(mask_nai, vmin=0, vmax=1)
ax[0].set_title("Mask \n'naive subsampling'", fontsize=20)
add_colorbar(im, "bottom", size="20%")

im = ax[1].imshow(mask_var, vmin=0, vmax=1)
ax[1].set_title("Mask \n'variance subsampling'", fontsize=20)
add_colorbar(im, "bottom", size="20%")

noaxis(ax)
/home/docs/checkouts/readthedocs.org/user_builds/spyrit/envs/3.1.1/lib/python3.11/site-packages/matplotlib/cbook.py:684: DeprecationWarning: __array__ implementation doesn't accept a copy keyword, so passing copy=False failed. __array__ must implement 'dtype' and 'copy' keyword arguments. To learn more, see the migration guide https://numpy.org/devdocs/numpy_2_0_migration_guide.html#adapting-to-changes-in-the-copy-keyword
  x = np.array(x, subok=True, copy=copy)
Measurements for accelerated acquisitions
We instantiate two HadamSplit2d objects corresponding to the two subsampling strategies. By default, the HadamSplit2d object uses the “naive” subsampling strategy.
meas_nai = HadamSplit2d(64, M=M)
For the variance subsampling strategy, we specify the order matrix using the order attribute.
meas_var = HadamSplit2d(64, M=M, order=Ord_variance)
We now simulate the measurements from both subsampling strategies. Here, we simulate measurements using the matrix \(H\), i.e., we compute \(m = HXH^\top\). This produces vectors of size \(M = 64 \times 64 / 4 = 1024\).
m_nai = meas_nai.measure_H(x)
m_var = meas_var.measure_H(x)

print(f"Shape of measurement vectors: {m_nai.shape}")
Shape of measurement vectors: torch.Size([7, 1, 1024])
We transform the two measurement vectors as images in the Hadamard domain thanks to the function spyrit.core.torch.meas2img().
Shape of measurements: torch.Size([7, 1, 64, 64])
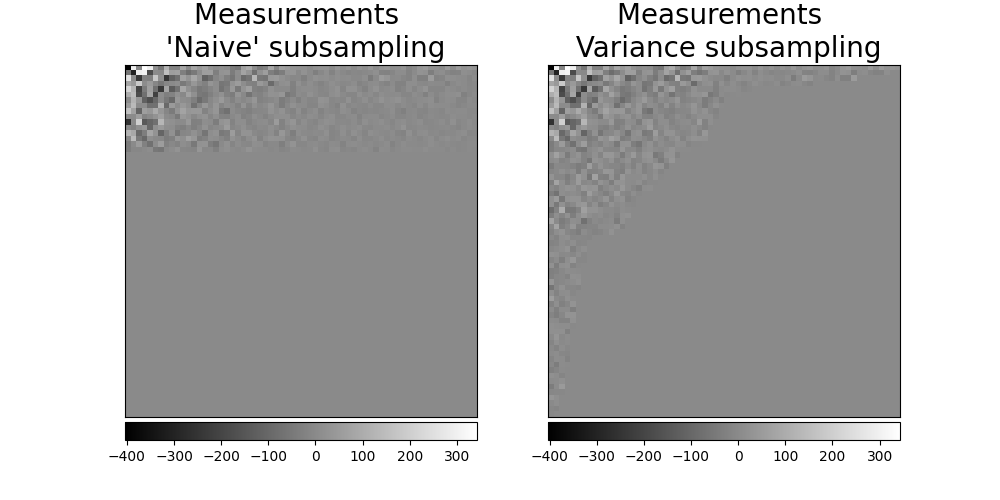
We finally plot the measurements corresponding to one image in the batch.
f, ax = plt.subplots(1, 2, figsize=(10, 5))
im = ax[0].imshow(m_nai_plot[i_plot, 0, :, :], cmap="gray")
ax[0].set_title("Measurements \n 'Naive' subsampling", fontsize=20)
add_colorbar(im, "bottom")

im = ax[1].imshow(m_var_plot[i_plot, 0, :, :], cmap="gray")
ax[1].set_title("Measurements \n Variance subsampling", fontsize=20)
add_colorbar(im, "bottom")

noaxis(ax)
/home/docs/checkouts/readthedocs.org/user_builds/spyrit/envs/3.1.1/lib/python3.11/site-packages/matplotlib/cbook.py:684: DeprecationWarning: __array__ implementation doesn't accept a copy keyword, so passing copy=False failed. __array__ must implement 'dtype' and 'copy' keyword arguments. To learn more, see the migration guide https://numpy.org/devdocs/numpy_2_0_migration_guide.html#adapting-to-changes-in-the-copy-keyword
  x = np.array(x, subok=True, copy=copy)
/home/docs/checkouts/readthedocs.org/user_builds/spyrit/envs/3.1.1/lib/python3.11/site-packages/matplotlib/cbook.py:684: DeprecationWarning: __array__ implementation doesn't accept a copy keyword, so passing copy=False failed. __array__ must implement 'dtype' and 'copy' keyword arguments. To learn more, see the migration guide https://numpy.org/devdocs/numpy_2_0_migration_guide.html#adapting-to-changes-in-the-copy-keyword
  x = np.array(x, subok=True, copy=copy)
We can also simulate the split measurements, i.e., the measurement obtained from the positive and negative components of the Hadamard transform. This produces vectors of size \(2 M = 2 \times 64 \times 64 / 4 = 2048\).
y_var = meas_var(x)
print(f"Shape of split measurements: {y_var.shape}")
Shape of split measurements: torch.Size([7, 1, 2048])
We separate the positive and negative components of the split measurements.
y_var_pos = y_var[..., ::2]  # Even rows
y_var_neg = y_var[..., 1::2]  # Odd rows

print(f"Shape of the positive component: {y_var_pos.shape}")
print(f"Shape of the negative component: {y_var_neg.shape}")
Shape of the positive component: torch.Size([7, 1, 1024])
Shape of the negative component: torch.Size([7, 1, 1024])
We now send the measurement vectors to Hadamard domain to plot them as images.
Shape of the positive component: torch.Size([7, 1, 64, 64])
Shape of the negative component: torch.Size([7, 1, 64, 64])
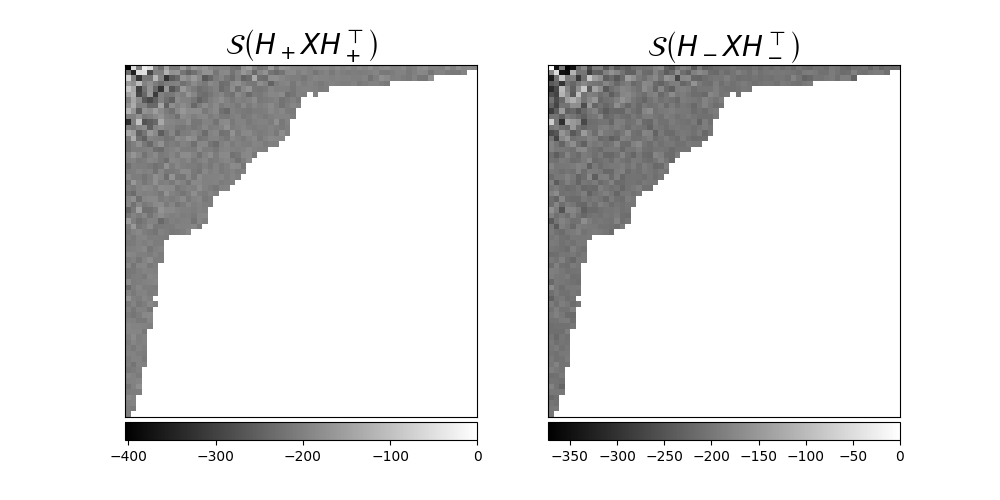
We finally plot the measurements corresponding to one image in the batch
f, ax = plt.subplots(1, 2, figsize=(10, 5))
im = ax[0].imshow(m_plot_1[i_plot, 0, :, :], cmap="gray")
ax[0].set_title(r"$\mathcal{S}\left(H_+XH_+^\top\right)$", fontsize=20)
add_colorbar(im, "bottom")

im = ax[1].imshow(m_plot_2[i_plot, 0, :, :], cmap="gray")
ax[1].set_title(r"$\mathcal{S}\left(H_-XH_-^\top\right)$", fontsize=20)
add_colorbar(im, "bottom")

noaxis(ax)
/home/docs/checkouts/readthedocs.org/user_builds/spyrit/envs/3.1.1/lib/python3.11/site-packages/matplotlib/cbook.py:684: DeprecationWarning: __array__ implementation doesn't accept a copy keyword, so passing copy=False failed. __array__ must implement 'dtype' and 'copy' keyword arguments. To learn more, see the migration guide https://numpy.org/devdocs/numpy_2_0_migration_guide.html#adapting-to-changes-in-the-copy-keyword
  x = np.array(x, subok=True, copy=copy)
/home/docs/checkouts/readthedocs.org/user_builds/spyrit/envs/3.1.1/lib/python3.11/site-packages/matplotlib/cbook.py:684: DeprecationWarning: __array__ implementation doesn't accept a copy keyword, so passing copy=False failed. __array__ must implement 'dtype' and 'copy' keyword arguments. To learn more, see the migration guide https://numpy.org/devdocs/numpy_2_0_migration_guide.html#adapting-to-changes-in-the-copy-keyword
  x = np.array(x, subok=True, copy=copy)
Total running time of the script: (0 minutes 5.537 seconds)